When reading the below, know that it is okay if you don’t fully understand it. As we move forward, we will apply the readings to exercises, which will make what you read here more understandable and more meaningful.
What is Data?
In short, data is a collection of facts, statistics, measurements, and the like that are recorded (or should be recorded) using standardized methods. Data is the smallest or rawest form of information and, as such, requires analysis and interpretation. Technically, data isn’t even information but, instead, “pre-information,” since information is derived from data. Think of data as being like single musical notes and information as being like musical cords—notes work together to make cords, as data points work together to make information. Satellite images can be data, as can geographic coordinates, blood test results, answers to interview questions, and so on. Data can be deliberately collected—scientists are constantly collecting data to keep track of climate change—and it can be extracted from existing information—historians extract data points (e.g., dates, names, locations) from personal letters and diaries. In other words, data can be a lot of different things, in a lot of different formats, and come from a lot of different sources. When structured, data can be ingested into a database and be visualized using data visualization tools.
There are two types of data, quantitative and qualitative. Quantitative, as the name suggests, relates to the quantity of something. Qualitative is data collected in a non-numerical and non-binary way. When you fill out a survey, and it asks you to answer yes or no, that is quantitative. When the survey asks you to write out a more nuanced answer, that is qualitative. Methods like coding are required to analyze data. Coding is not meant to mean “computer coding,” but, instead, the categorization of data points and the act of looking for patterns and differences within those data points.
Related Terms:
- Data points are single units of data or single observations, e.g., a single measurement or a single geolocation point.
- A data set (or dataset) is a collection of data. Typically, it is structured and housed in some form of table, e.g., a spreadsheet.
Data & Literature
It’s fun and trendy to say things like, “literature is data,” and understandably, some literary scholars bristle when they hear this. It seems to turn literature and literary studies into a cold science. In actuality, this expression isn’t true. Literature isn’t data, but it can be explored using quantitative and qualitative data-oriented methods. An example of a “data-oriented method” is the use of a basic word analysis tool, which uses things like word count, a quantitative method. Literature can also be coded, in the qualitative data sense, and visualized. We will get more into the details of what this means going forward.
In this class, we will be using qualitative and quantitative methods to explore literature. To begin this process and to begin to understand how to work with data, you need to understand the basics of unstructured and structured data. Structured data is data that is organized so that it can be more effectively analyzed, in particular by tools like databases and data visualization applications. (Picture a well-organized spreadsheet.) Unstructured data is, essentially, a pool of content or data points that are not organized and categorized. (Picture a Scrabble bag full of letters.)
Structured and Unstructured Literature As Data
The following video provides you with a very simple example of how unstructured and structured data methods can apply to the study of literary texts. The demonstration uses Voyant and refers to a tool called Lexos. When we get to the word analysis exercises, you will be given much more detail about these tools:
In the example above, I structured data by dividing a novel into individual text files. There are far more sophisticated ways to structure data using things like spreadsheets (and XML and JSON based schemas), however. In fact, understanding how things like spreadsheets work can teach you a lot about working with data and about how databases and data visualization tools work. (Data is often imported into and exported from databases via spreadsheets or related formats like CVS.) To understand how spreadsheets work, let’s start with the example below:

This is a basic spreadsheet mockup. Notice how it is made up of columns and rows and how each column has a header at the top. This header is called an attribute. An attribute describes everything that falls within it, or in this case underneath it. Think of it like tagging. Everything in a column is tagged by the attribute (header) at the top. Each horizontal line is a row, and a single row makes up what is called a record, meaning a series of data points that go together. Let’s put this into a more relatable context. Below is a DMV spreadsheet from an imaginary DMV database:

See how under the attribute first name, only first names are listed? If someone were to make a mistake and put a last name there, the DMV database would still “think” it was a first name and treat it accordingly. Also, see how the data in a single row goes together, how each row is the data found on an individuals drivers license? This helps demonstrate how our driver’s licenses represent records in the DMV’s database. Finally, do you notice how there are no repeated driver’s license numbers? These are unique identifiers that help distinguish records from one another. They are especially important when people have matching or similar information, e.g., a father and son who live at the same address and have the same names. Unique identifiers play an important role in all kinds of structured data, not just driver licenses. Think of them as a record’s fingerprint. They distinguish records from one another, and they help make records more findable.
Digital Humanities Examples
Let’s look at Stanford University’s Mapping The Republic of Letters’ “The Correspondence Network of Benjamin Franklin: The London Decades.” There you will find articles and visualizations that use data from Benjamin Franklin’s Correspondence between 1757-1775. You also will find the data schema, which explains things like how the data was structured and provides links to the datasets, which are formatted as spreadsheets. Below is one of the datasets, note the use of attributes:
Franklin’s correspondence (1757-1775) data from Stanford Digital Repository. Scroll through the spreadsheet to see more.
Because this data is structured, scholars can use it to create visualizations like the one below by Claire Rydell Arcenas, a professor of history at the University of Montana. It shows the geographic scope of Franklin’s correspondence network from 1757-1775 :
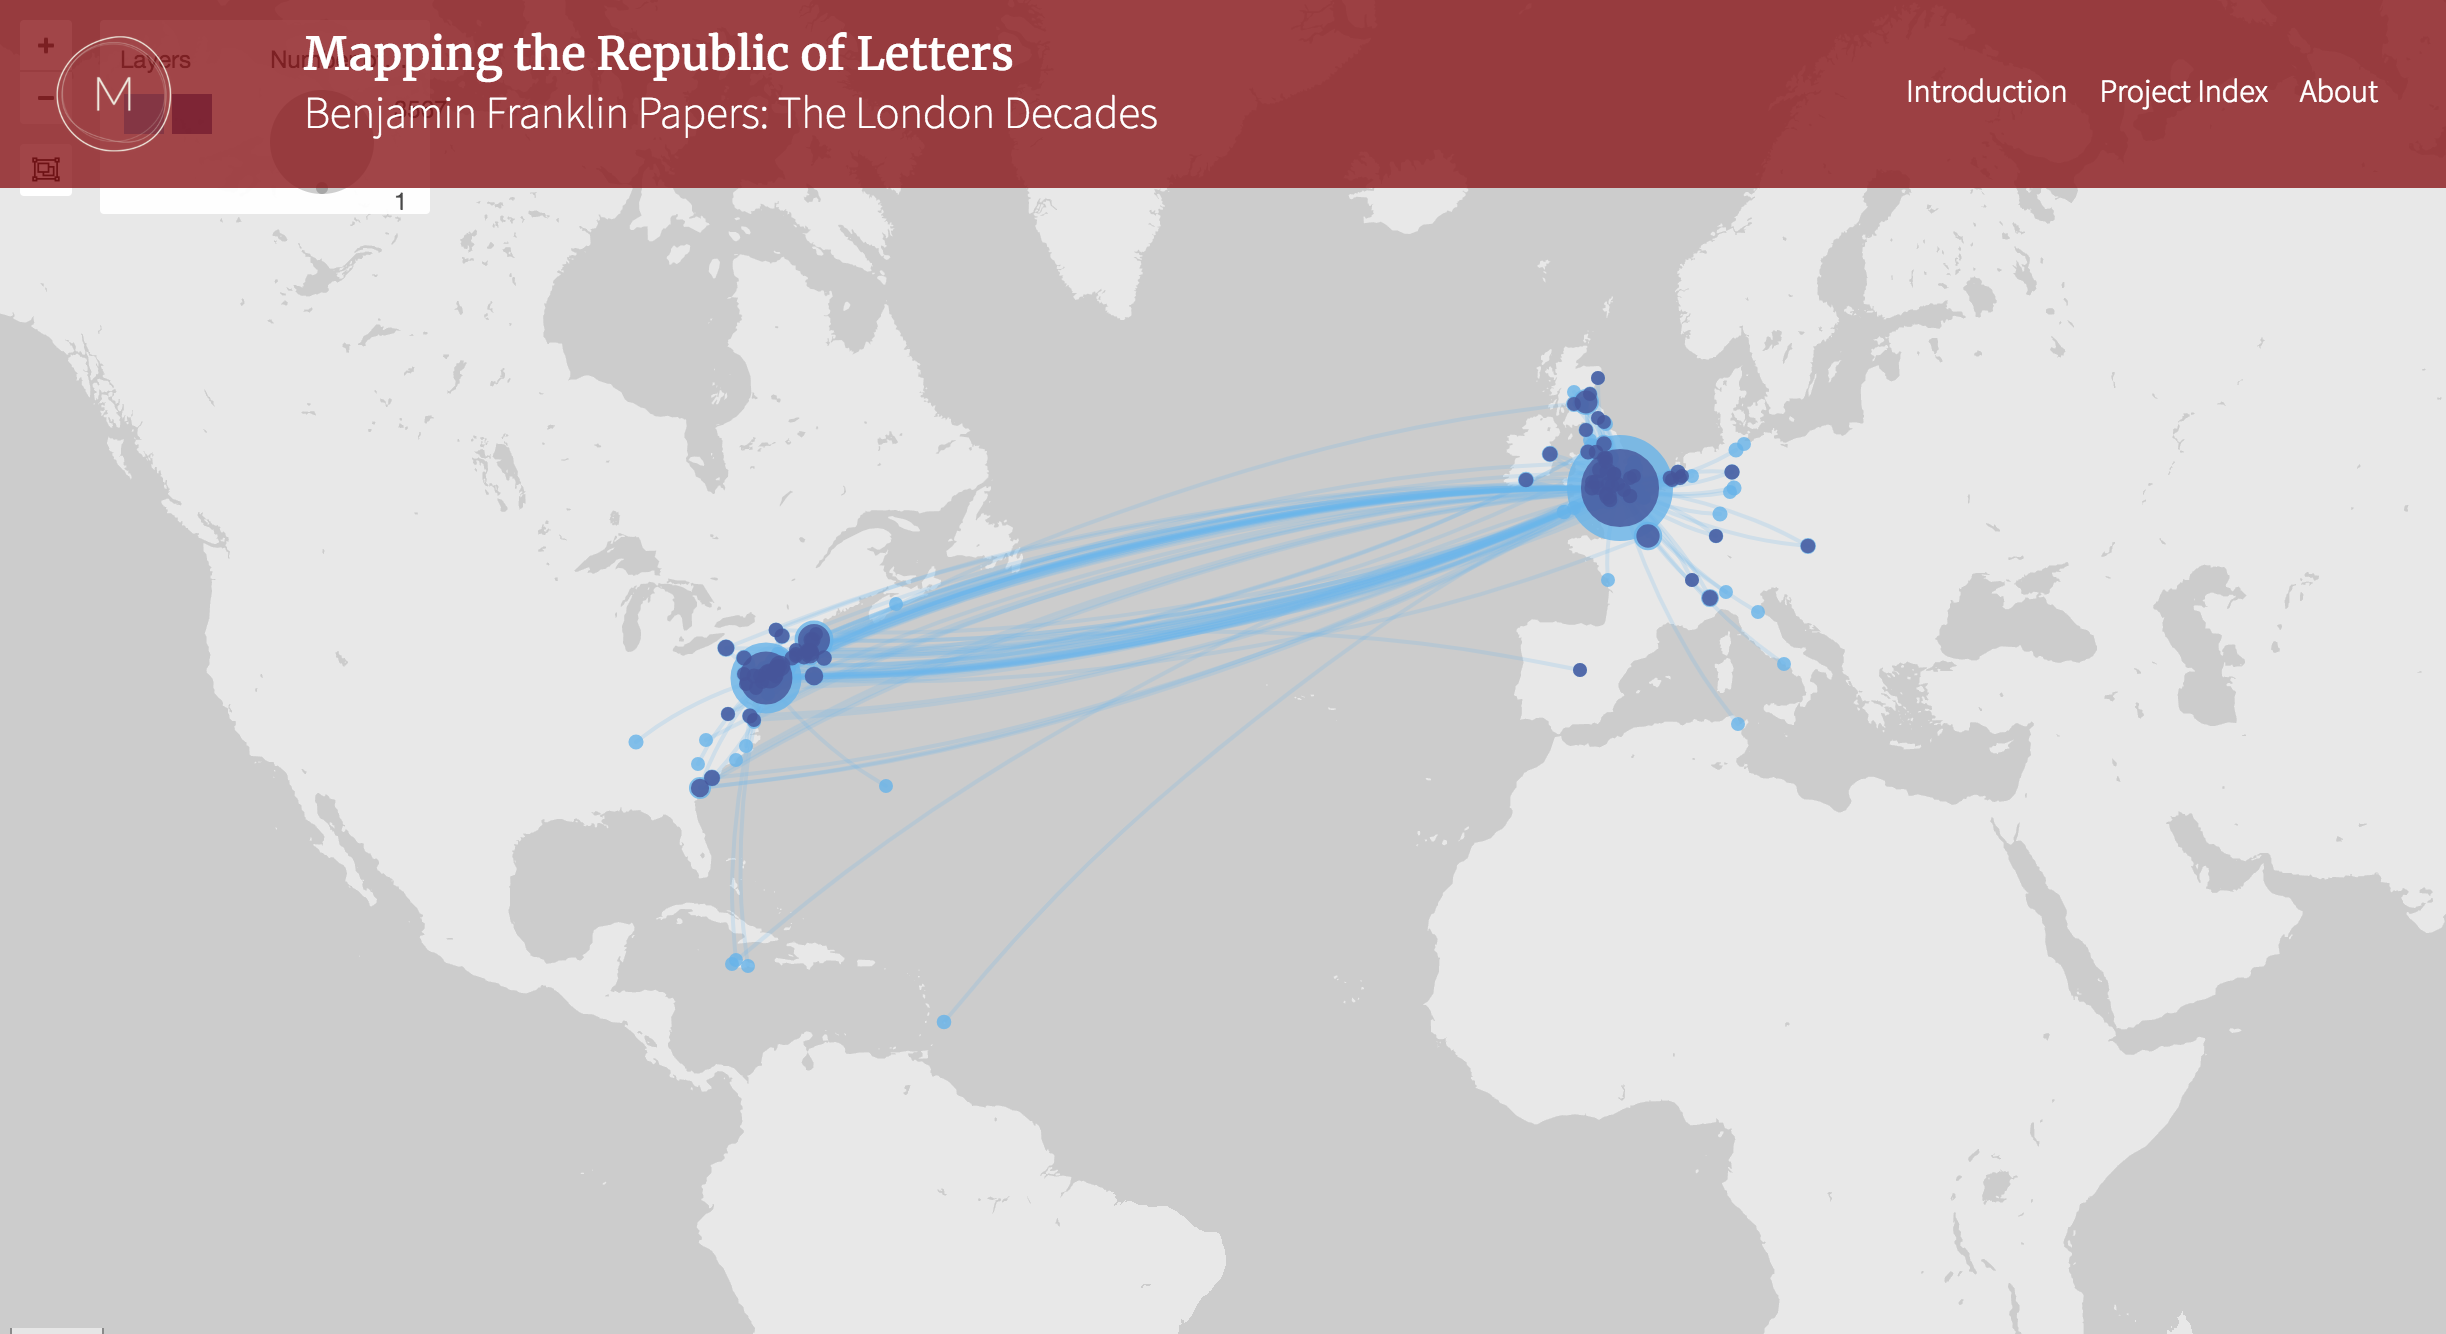
The creation of this visualization and other work Dr. Arcenas did with the data, led her to write the article “Benjamin Franklin Papers: The London Decades,” which is currently under review. (Visit the site to learn more about this visualization and how it works.)
Structuring a Spreadsheet
When structuring data or literature as if it were data, you need to think deeply about it. Let’s imagine a scenario where you want to explore Jane Eyre from the standpoint of who speaks, how much a character speaks, and how the amount of speaking might relate to gender. You could structure like the following:
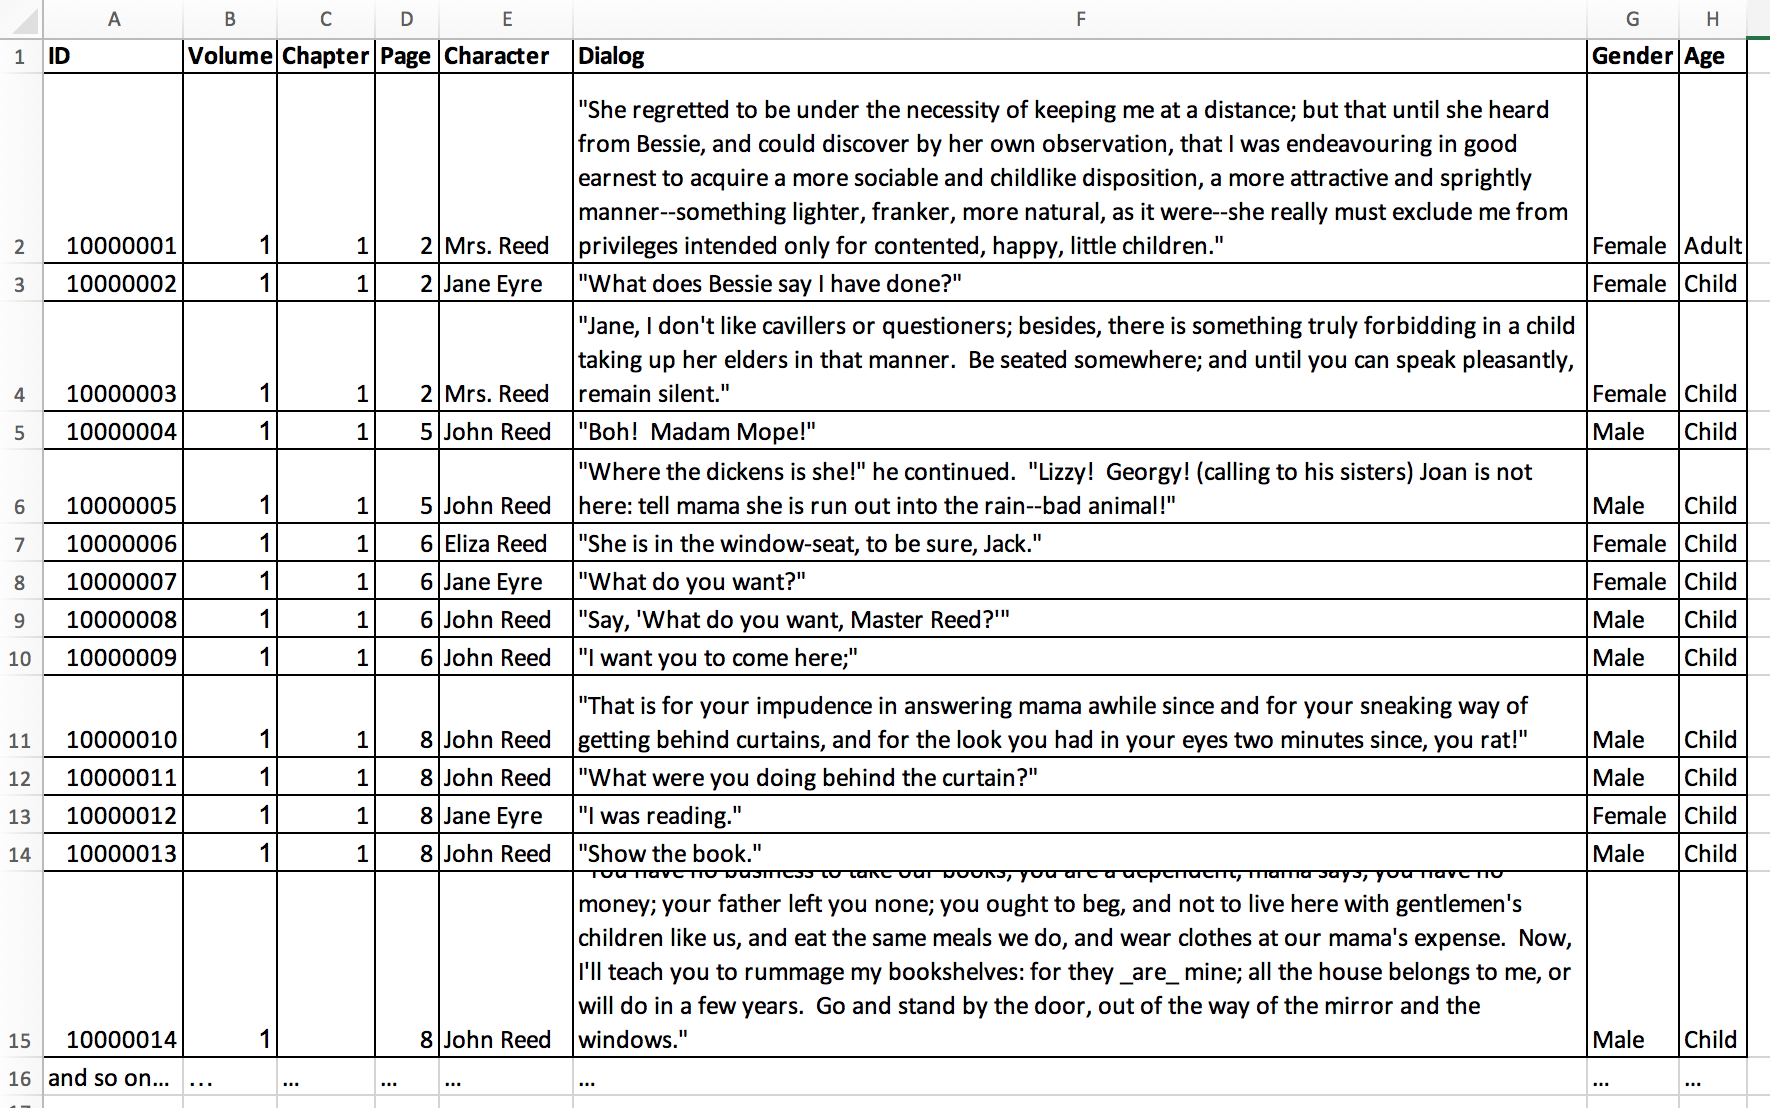
By parsing out the “data” this way, you would be able to pinpoint, for example, how many times men and women speak in the novel and wherein the novel they speak the most. You could also more easily analyze the dialog since all of the non-dialog text has been stripped away.
Going forward, we will learn more about the nuances of data and how data, while it seems like a black and white science, can be in the world of digital humanities, anything but binary.